
Originally published on Medium.
This article picks up where Why the Log-Cost Playbook Needs to Change left off. That article argued that the familiar levers, from discounts to sampling to shorter retention, all rest on a guess about what you will need later, and it set out two ways to preserve more while your backend indexes less: lossless consolidation and rich summaries. It deliberately avoided quoting a savings percentage. This one shows lossless consolidation at work on the index where none of those levers are allowed.
Audit, access and transaction indexes cannot be dropped, sampled or expired early, so every pipeline leaves them whole. Chiron consolidates them losslessly, inside your cluster, before Splunk indexes them. Here is what that looks like to a Splunk user: the same search, the same rows, the same panels, on a smaller index. And here is how to verify it on your own index within hours.
What you are looking at
Lossless here means one thing. A repeating pattern is stored once, each event's own values are stored beside it, and every event can be rebuilt exactly. The reduction comes from the pattern, not from leaving anything out. A search on the consolidated index adds one macro, chiron_unfold, and gets every event back.
Every row below is a reason a Splunk admin gives for not touching this index. The middle column is what this article shows from our dev cluster. The right column is what the verification report adds on your index, because the numbers that matter most are yours and depend on your data.
| The objection | What this article shows | What the report adds, on your index |
|---|---|---|
| "Lossless means lossy with a footnote" | Two searches, five rows, zero differences, including the failure line that has no trace id (Figures 1 to 3) | Every event reconstructed from the consolidated index and compared with the raw one, with the difference count |
| "Our searches will break" | Two lines change per search, the macro and a filter, shown in the figures | Your saved searches run on both indexes, diffed, with the rewrite list before the pilot |
| "Our dashboards will move" | Six panels read the same on both indexes, no panel edited (Figures 4 to 6) | Your panels |
| The objection | What this article shows | What the report adds, on your index |
|---|---|---|
| "We cannot reduce data we must keep" | The index in the figures is under the policy; how much smaller yours gets depends on coverage | Indexed GB/day, raw and consolidated, from your license report |
| "Searches will get slower" | The macro does its work at search time | One search timed on both indexes |
| "The engine will eat the saving" | 5 to 10 percent of the ingestion pipeline's compute, measured at 1 TB/day | Measured on your pipeline |
| "What is that in money" | GB/day saved at your Splunk rate, less Chiron's annual fee |
The index no pipeline has been allowed to touch, consolidated, with every event still there to be searched.
What the figures compare
The retention requirement. The rule applied to the index in the figures is the one a regulated estate applies to audit, access and transaction records: every event is kept, nothing is sampled, dropped, trimmed or expired early, and any event must be returnable exactly as it was emitted.
The configurations.
| Configuration | What it does to an index under that rule |
|---|---|
| A. Raw | Splunk indexes the stream as emitted. The left side of every figure. |
| B. Per-event pipeline, Cribl Stream or Splunk Edge Processor | Not run, and untested here. Under the retention requirement above, dropping, sampling, trimming and lossy aggregation are disallowed on this index, so their output equals their input. We state this as policy, not as a measurement, and a Cribl user will recognise it: the usual Cribl answer for this data is to route it out of Splunk to object storage and replay on demand, which is a different trade, searchable in Splunk against not, and is not measured here. |
| C. Chiron, lossless policy | The engine runs in the cluster, in front of Splunk, and stores each matched pattern once with every event's own values beside it. Unmatched events pass through untouched. The macro returns every event at search time. The right side of every figure. |
Splunk's own levers, SmartStore, frozen buckets and Federated Search, move where the data lives and what it costs to store. They do not change what is indexed, so they are not in the table.
For completeness: Chiron also runs conditional drop and Kafka-topic routing as policies. It does not trim or redact fields, so a trimming or masking step you run today stays where it is. Neither matters on this index, where none of those operations is permitted.
Nothing in configuration B is a weakness of Cribl. It is the retention rule doing what it is for.
The same answer from a smaller index
Two searches, raw on the left and consolidated on the right, from the dev cluster's application index under the lossless policy.
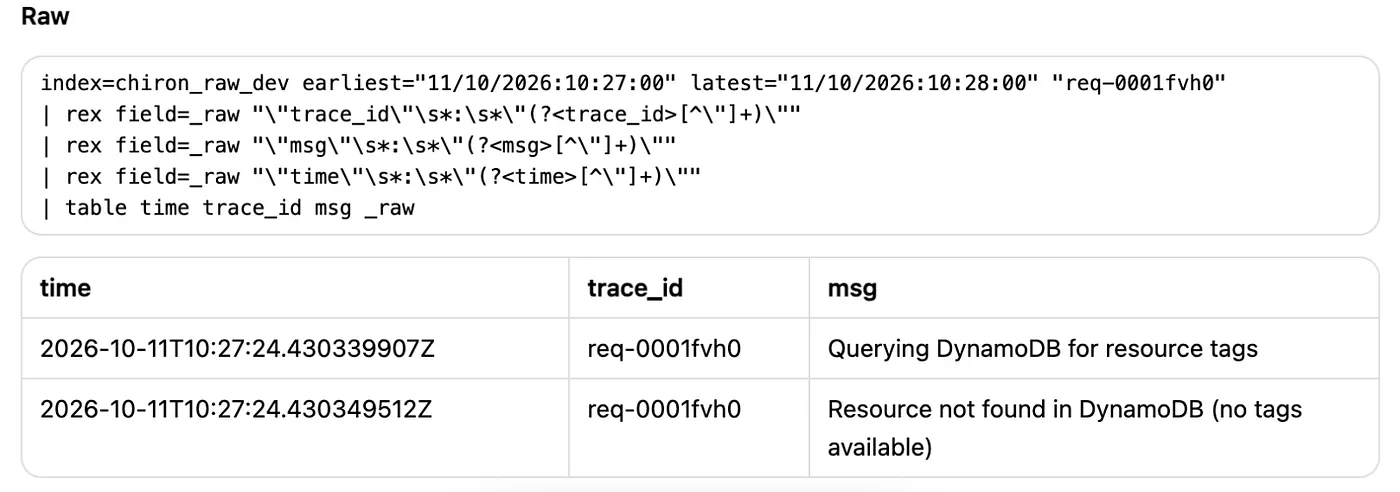
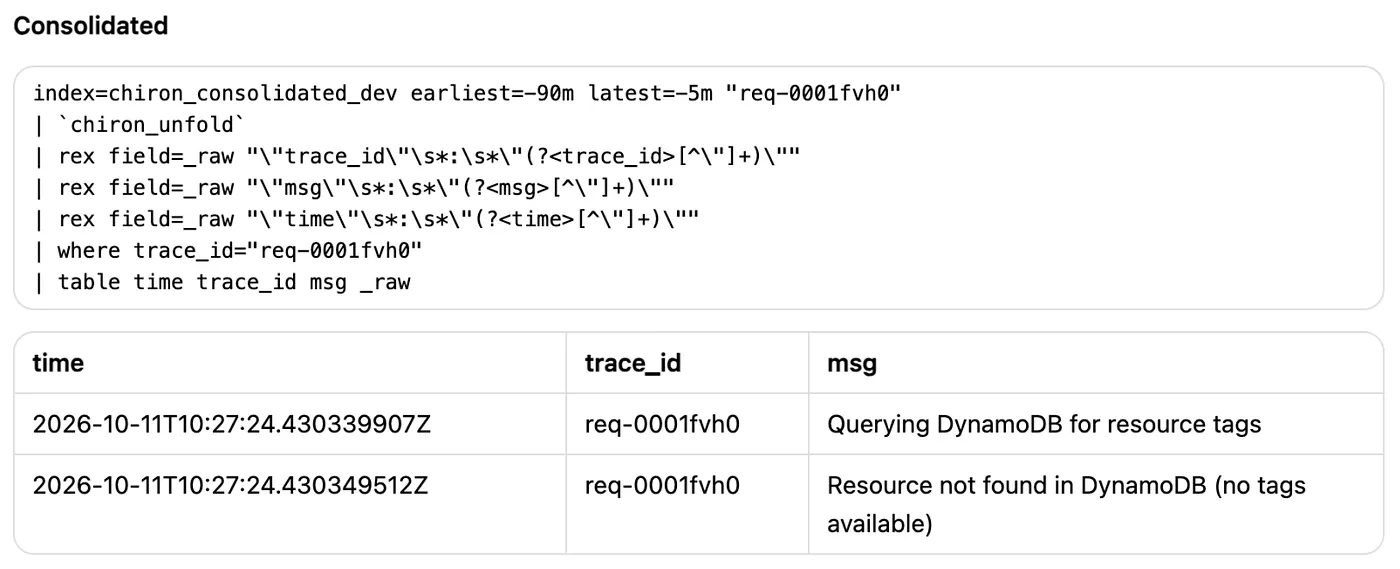
A trace. Figure 1 is a raw search for trace req-0001fvh0. Figure 2 is the same trace on the consolidated index. Two rows on each side, the same timestamps to the nanosecond, the same messages.
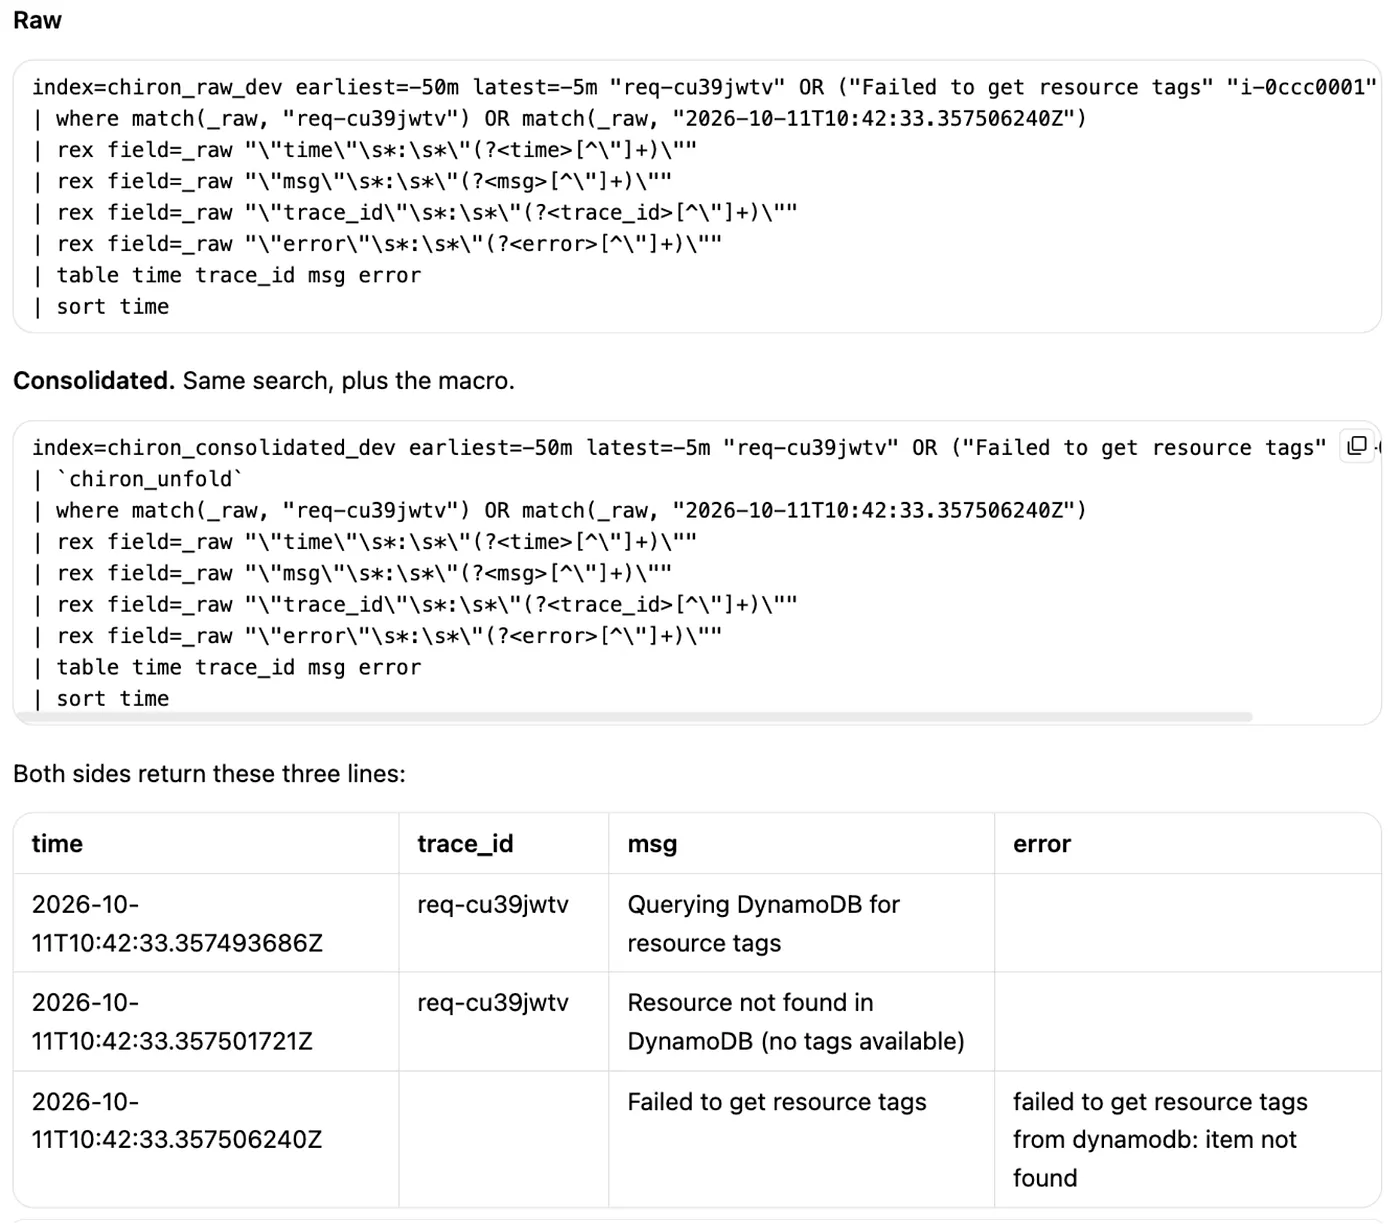
An incident where the failure line has no trace id. Trace req-cu39jwtv queries DynamoDB for an instance's tags. The second line says the resource was not found. The third line establishes that the client failed the call, and carries the exact error. It has no trace id; it joins the other two on the instance ARN and the same millisecond. Without the third line you know the lookup missed, but not that the request failed or why. Figure 3 is both searches and the rows both return.
| Search | Raw rows | Consolidated rows | Timestamps | Messages | Error string |
|---|---|---|---|---|---|
Trace req-0001fvh0 |
2 | 2 | identical to the nanosecond | identical | none on either |
Incident req-cu39jwtv |
3 | 3 | identical to the nanosecond | identical | identical on line 3 |
Five rows, two searches, zero differences, and the line with no trace id is one of them.
Searches and dashboards unchanged
A reduction that breaks the searches people run is a migration, not a saving. Two things to look at: what changes in a search, and what happens to the dashboards built on the index.
What changes in a search. The consolidated search adds the chiron_unfold macro after the index clause, which returns every event from its record. A search that filters on a field inside the record adds a where on that field after the macro, because the term search matched a record holding several events. Figures 1 to 3 show both lines. Everything after them, the field extractions and the table, is unchanged. Some saved searches need that rewrite; the verification report lists which ones before a pilot starts.
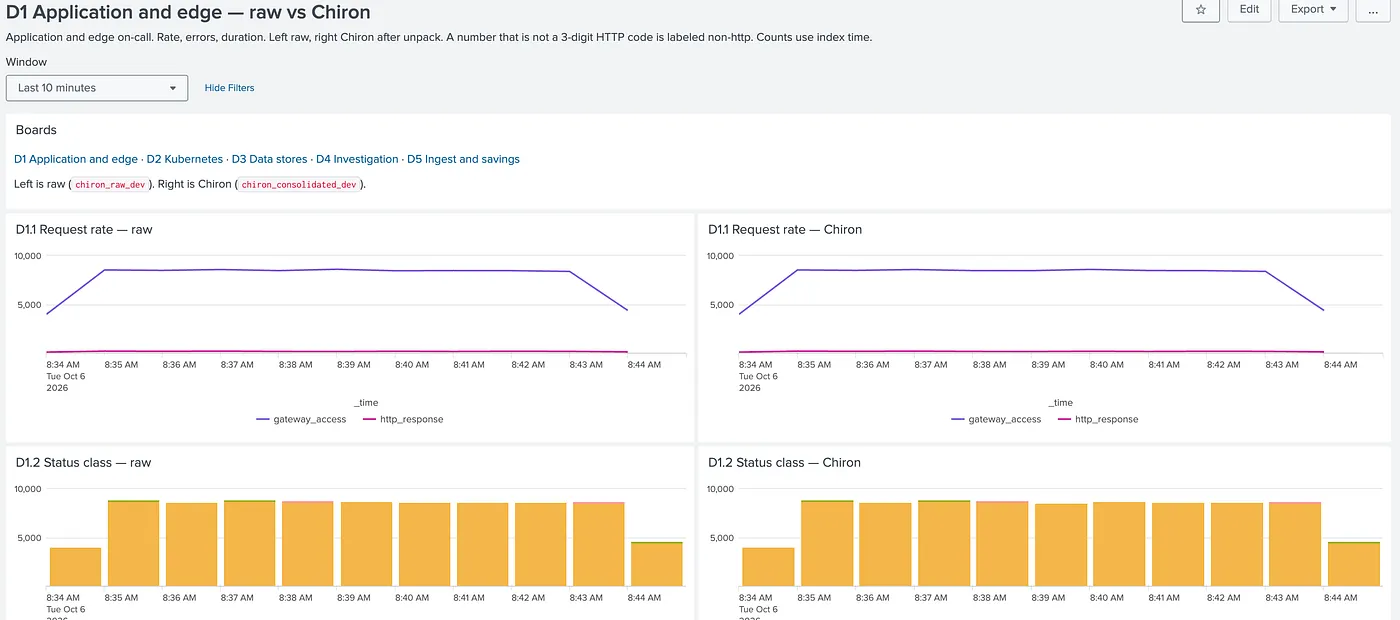
Dashboards. No panel was edited; the macro went into each base search. The three boards below compare raw and consolidated results from the dev cluster's application and data-store logs under the lossless policy. They complement the search examples above by showing that existing operational dashboards continue to work on consolidated data. Figure 4 is the application and edge board, request rate by source and status class per minute. Figure 5 is the Valkey save rate, two series. Figure 6 is the Kafka coordinator rate.


| Panel | Measure | Raw | Consolidated | Match |
|---|---|---|---|---|
| D1.1 Request rate | gateway_access, plateau per minute |
about 8,600 | about 8,600 | yes |
| D1.1 Request rate | http_response, per minute |
about 250 | about 250 | yes |
| D1.2 Status class | events per minute, 2xx to 5xx stacked | about 8,600 | about 8,600 | yes, same mix |
| D3.1 Valkey save rate | background_save_ok, peak at 9:25 |
about 620 | about 620 | yes |
| D3.1 Valkey save rate | saved_on_disk, peak at 9:25 |
about 640 | about 640 | yes |
| D3.5 Kafka coordinator rate | count, peak at 9:25 | about 330 | about 330 | yes |
Each board compares raw and consolidated panels within its own captured window; different figures need not share a date. Values are approximate readings from the panels.
The counts hold because every event is still there to be counted. A sampled index would have moved all six by the sampling rate. One limit on what these panels show: the dev simulator replaces numeric fields such as status and size with placeholder values, so D1.2 shows that the count in each class matches on both sides, not what the classes mean.
Run time. The macro does its work at search time, so this is the number a Splunk admin asks for first. It is not measured in this article; the verification report times one search on both indexes.
Two lines added to a search, six panels reading the same, and no panel edited.
The four answers
Lossless is a word every vendor uses. It means something only with four answers attached, so here are ours for this index.
- What is covered. The events that match a pattern policy. How much of an index that is depends on the index; an audit index with a few hundred event shapes covers almost entirely, one with free-text payloads covers less. Everything else passes through untouched, and if the engine stops, the pipeline continues.
- What reconstructs. Every covered event, from the pattern plus its own values, at the original cardinality. Figures 1 to 3 show it on five rows; the verification report shows it on every event in your index.
- What does not. Nothing in the covered set. The report proves this per index by reconstructing every event and running your own saved searches on both sides.
- What changes. The macro in every search on the consolidated index, and a rewrite for some saved searches, listed before the pilot.
After the compliance index: the summary policy
The lossless policy is for data you must keep exactly. Most of a Splunk estate is not that. Gateway, proxy and retry traffic is read as rates and bursts, and the questions asked of it are how many, from where, in which window, with what outcome. For that data Chiron has a second policy, and it has an explicit tradeoff.
Rich summaries retain selected entities, timing, counts, outcomes and relationships rather than every original line. Figure 7 illustrates it on the incident from Figure 3, a DynamoDB resource-tag lookup that ended in failure: the related messages are connected by the affected EC2 instance ARN within a bounded window. The figure is conceptual, not an emitted summary record from the dev cluster. It shows what a diagnostic summary is meant to convey, not measured query parity.
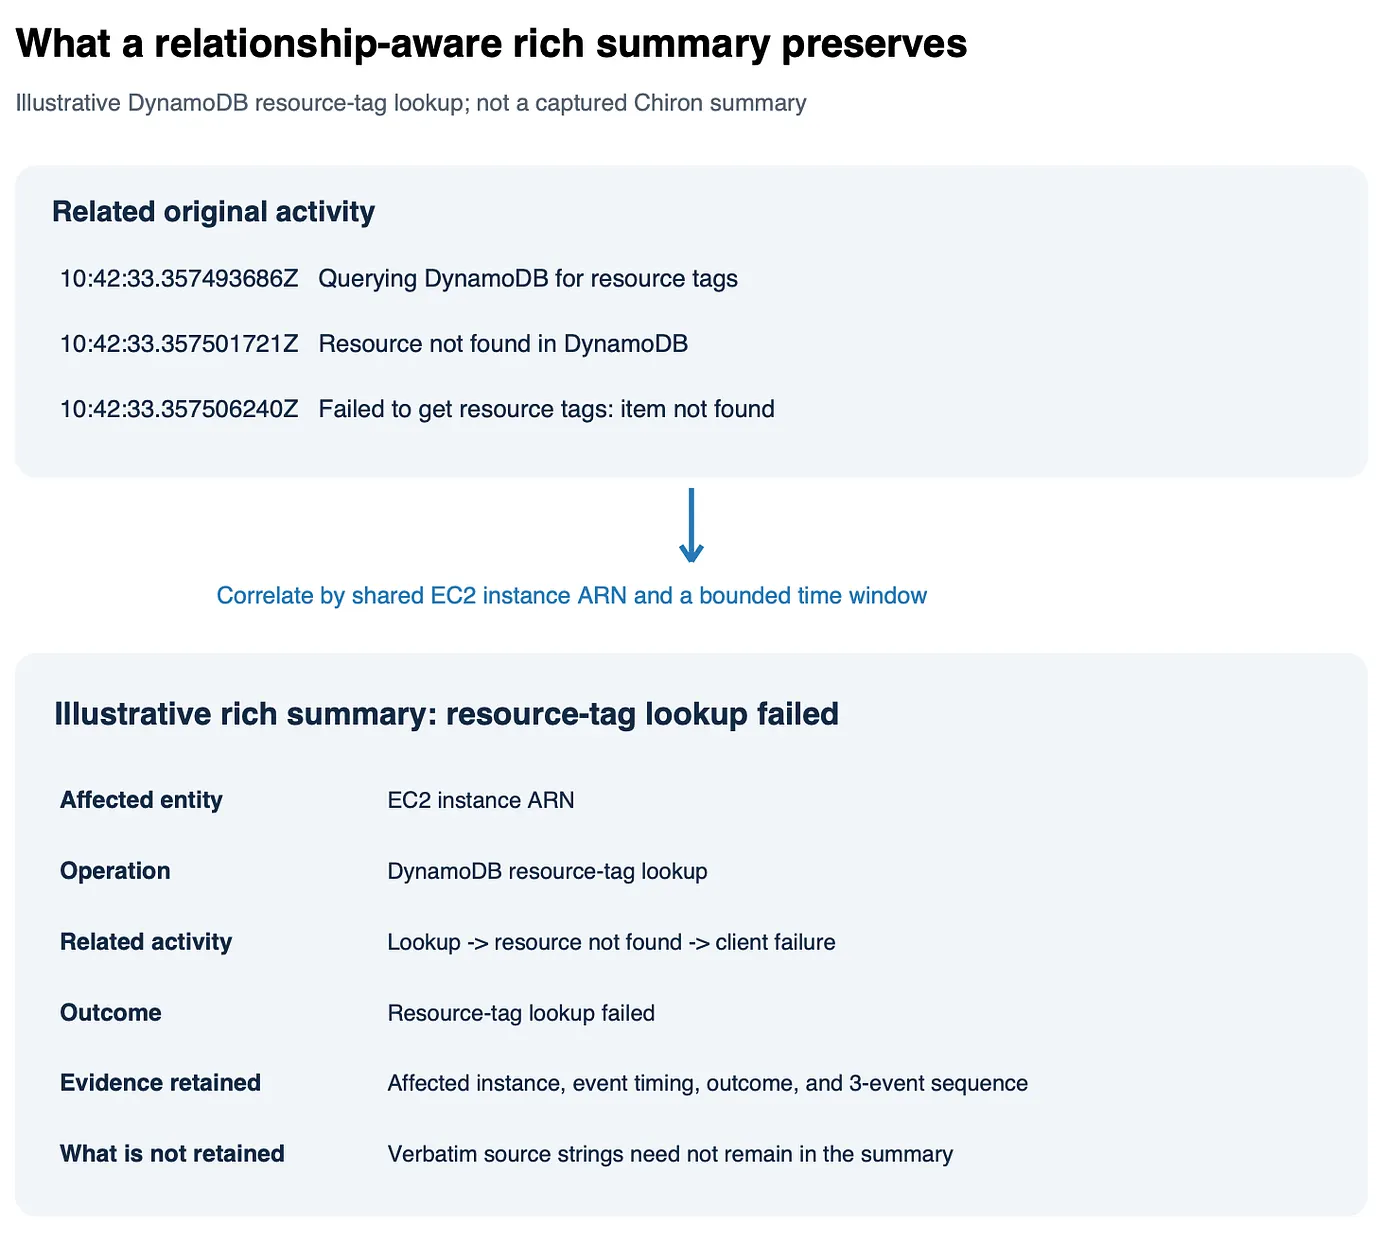
Why this differs from lossless consolidation:
- Lossless: every original message and field can be reconstructed from stored patterns and values.
- Rich summary: keeps the connected diagnostic explanation while allowing original strings to be omitted.
That is the tradeoff, and it is the whole of it: full-text search over the original strings is not available in the index. From November the originals are written to your own S3 in a layout Splunk Federated Search reads. We will report what that recovers once a real index has been reduced and searched back, and not before.
Chiron Summary benchmark: less data, same faults found
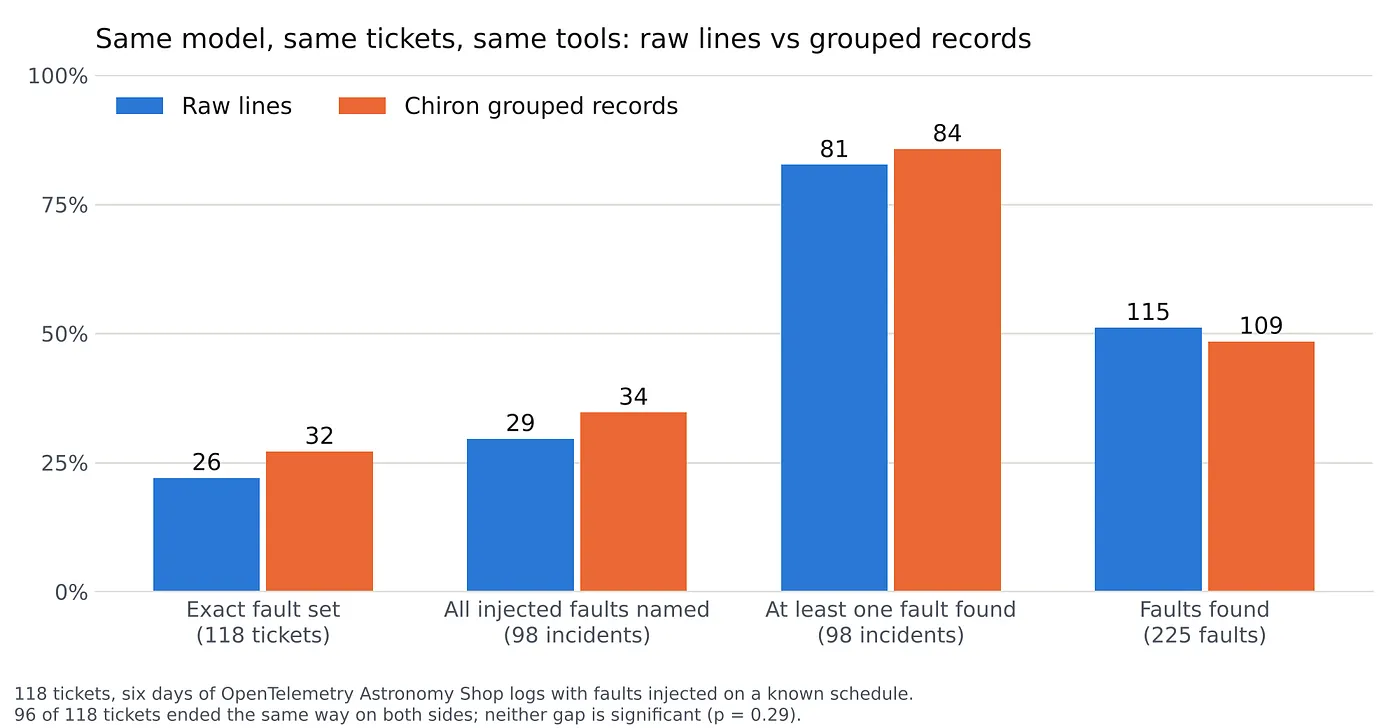
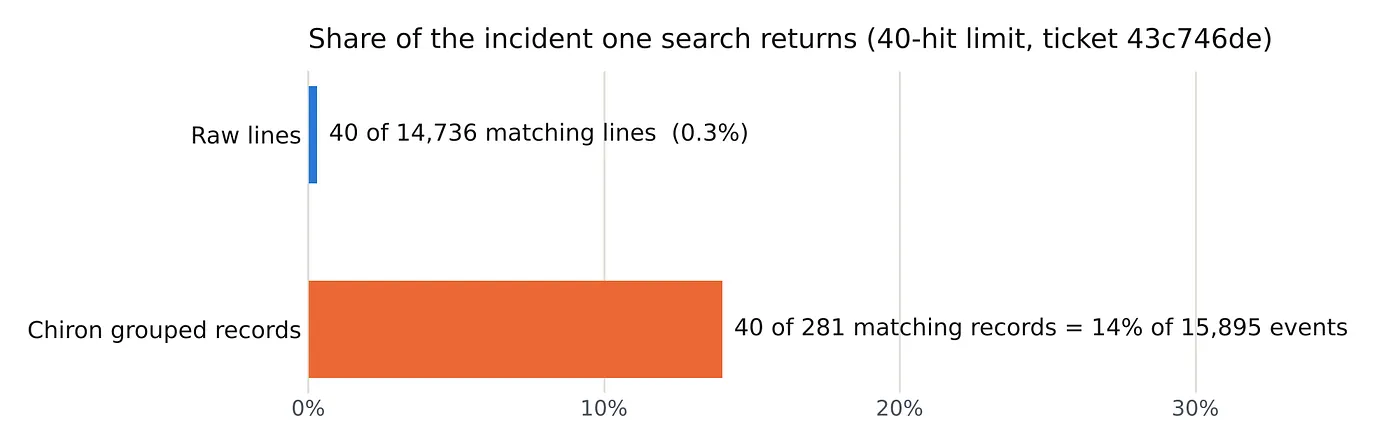
We tested the step the summary builds on. Six days of OpenTelemetry Astronomy Shop logs, with faults injected on a known schedule, went through Chiron's grouping: each eight-hour window shrank from 177,000 lines to 11,000 records. One model then hunted the faults behind 118 support tickets, once from raw lines and once from the records, with the same prompt, tools and budget. 96 of 118 tickets ended the same way. The records gave the exact fault set more often (32 vs 26); raw found slightly more individual faults (115 vs 109); neither gap is significant. Figure 9 shows why the records held up: one search returned 14% of the incident instead of 0.3%. This test kept every event inside the records. The summary run, with the original strings dropped, is next.
The summary path has no dashboard comparison in this article. We will publish one when both sides of the dev cluster cover the same window; until then the article makes no parity claim for it.
One policy for the data you must keep exactly, one for the data you read by question, and the tradeoff of the second named before you choose it.
How to read the figures
The cluster is ours and the workload is constructed. What the figures show of it: an API gateway tier, a registry service, application services that look up resource tags in DynamoDB, a Valkey cache and a Kafka cluster, all on Kubernetes, with audit and transaction records carried alongside ordinary application and gateway traffic. The figures were captured between Oct 6 and Oct 11 on a dev cluster, not at a customer.
Your number depends on coverage, the share of your index that a pattern policy matches. An audit index with a few hundred event shapes covers almost entirely; one with free-text payloads covers less. That is why the offer below is a sample of your index, not a quote.
The reasoning behind the two policies, and why the saving depends on coverage, is in Why the Log-Cost Playbook Needs to Change. This article is the demonstration; the measurement is the report on your index.
Two cost proofs of concept to date hit the number the customer set, on the first pass and with minimal effort. We cannot name them yet and will not quote their percentages until they sign off, so this article makes no claim from them.
Chiron is a weak fit for a fixed enterprise agreement with no indexer compute pressure, because the bill does not move when the ingest does. It is built for ingest-licensed or compute-constrained Splunk, where the indexes no pipeline has been allowed to touch are a material share of the bill.
The offer
Send a sample of one index. Within hours you get a verification report.
What the report gives you, by category:
- Lossless. The saving on the indexes you must keep exactly. Compliance-ready: every event reconstructable, no search result changed.
- Summary. The saving on the indexes you read by question. The larger number, with its one tradeoff named.
- Overall. The combined saving across your estate, in GB/day and in money at your Splunk rate.
All of it generated from your logs automatically. Nothing to configure.